Data Extraction
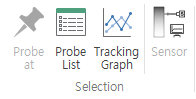
Opens a Dialog to view values at specific locations.
List
Enables/disables the List Pane that lists nodes created in Data Extraction.
Graph
Enables/disables the Graph Pane that outputs tracking results of points in the List.
Sensor
Opens the Sensor Dialog to monitor values at projected locations when viewing from a specific position in a specific direction, similar to an actual sensor.
None
Does not use color fill effects. The geometry is displayed in the default color.
Continuous Fill
Displays colors that change continuously according to the magnitude of the analysis result values. Used to check value distributions with smooth color transitions.
Band Fill
Displays colors in discrete steps by dividing analysis result values into fixed intervals. Makes it easy to distinguish which areas contain specific value ranges.
Contour
Displays lines connecting locations with the same result values. Used to check trends in result value changes or locate specific reference values.
Scalar Bar
Shows/hides the scalar bar in the view screen.
Local
Sets the scalar bar range based on the min/max of the current step.
Global
Sets the scalar bar range based on the min/max of all steps.
User Defined
Sets the scalar bar range based on user-specified criteria.
User Settings
Opens the Scalar Bar Dialog to modify scalar bar options.
Analysis Graph
Opens the Graph Pane to view graphs stored in the analysis results.
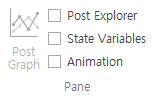
Post-Processing Explorer
Enables/disables the Post-Processing Explorer that displays stages/workpieces/dies based on information registered in the analysis results.
State Values
Enables/disables the State Values that displays state variables available from the analysis results.
Animation
Enables/disables the Animation Pane that plays an animation using the steps stored in the analysis results.